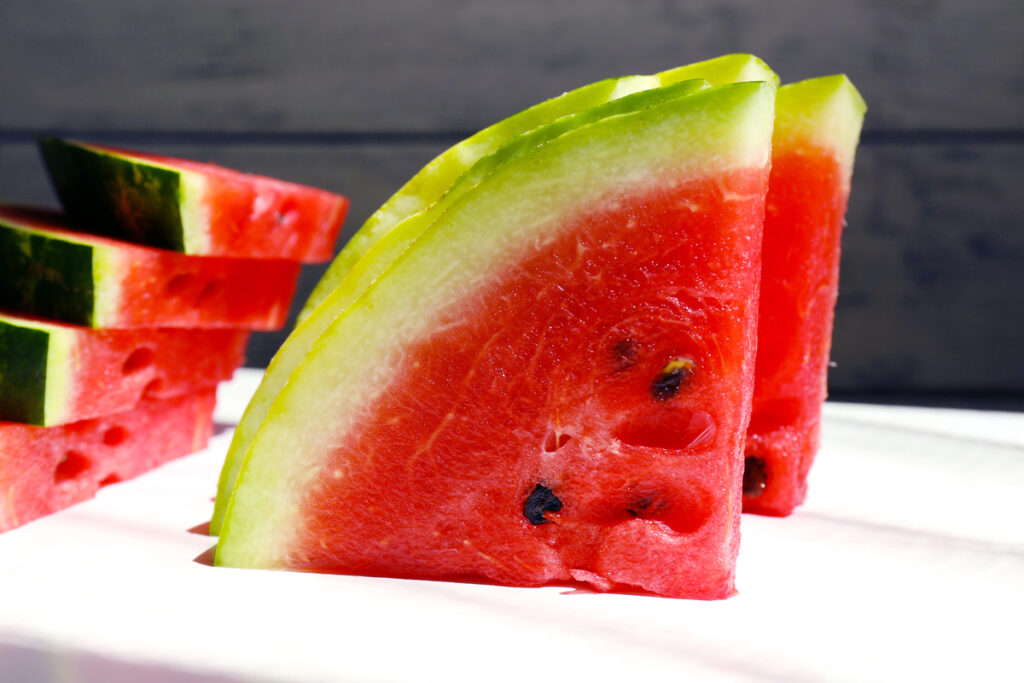
Watermelon has a high glycemic index, so should you skip it? Not so fast. The glycemic index only tells half the story, and one simple formula fills in the rest. Here is how to calculate glycemic load in under a minute, with a real example you can reuse at your next meal.
What the glycemic index actually measures
The glycemic index (GI) is a number from 0 to 100 that describes how much a food raises your blood sugar in the two hours after you eat it, compared with a reference. Pure glucose is set at 100, and every other food is scored against it.
The number comes from a standard lab test: volunteers fast for 12 hours, eat an amount of the food containing 50 g of available carbohydrates, and their blood sugar response is averaged across 10 people. The concept was introduced in 1981 by David J. Jenkins and his colleagues.
Foods are then sorted into three groups:
- Low GI: 55 or less (fructose at 19, lentils, most whole grains, most vegetables, peaches, strawberries)
- Medium GI: 56 to 69 (table sugar, basmati rice, unpeeled white potato, banana)
- High GI: 70 or more (glucose at 100, white bread, corn flakes, peeled white potato at 83)
The problem: GI ignores how much you eat
Here is the catch. Every GI value is measured on a portion containing 50 g of carbohydrates, whatever the food. But nobody eats a fixed 50 g of carbs every time they reach for a snack. A food can score high on the index while delivering very few carbohydrates in a normal serving, and the index alone will never show you that.
That gap is exactly what glycemic load (GL) was created to fix.
The simple formula behind glycemic load
Glycemic load combines the quality of the carbohydrate (its GI) with the quantity you actually eat in one portion:
Glycemic load = (GI × grams of carbohydrates per portion) ÷ 100
In plain words: take the GI, multiply it by the carbs in your serving, then divide by 100. You need two numbers, and the carbohydrate figure is usually printed on the nutrition label.
A real example: watermelon
A portion of watermelon has a GI of around 72, which puts it in the high category. But that portion only contains about 12 g of carbohydrates.
- 72 × 12 = 864
- 864 ÷ 100 = a glycemic load of 8.64
Now compare it with an illustrative portion of peeled white potato (GI 83) containing 30 g of carbohydrates: 83 × 30 ÷ 100 = 24.9. Both foods sit in the high GI group, yet the potato serving carries almost three times the glycemic load of the watermelon slice. The index ranked them as close cousins, the load shows how different they really are on your plate.
Three things the formula reveals
1. Portion size scales the load directly
The formula is linear. Double your watermelon to 24 g of carbs and the load doubles too: 72 × 24 ÷ 100 = 17.28. Same food, same GI, twice the impact.
2. You can work backwards
Want to keep a portion of peeled potato at the same load as one slice of watermelon? Flip the formula: carbs = load × 100 ÷ GI. That gives 8.64 × 100 ÷ 83, or roughly 10 g of carbohydrates of potato.
3. A low GI does not cancel out a huge serving
Fructose has a GI of just 19, so 30 g of it gives a load of 5.7. Low, but not zero, and it keeps climbing with every extra gram.
Common mistakes to avoid
- Treating a high GI as automatically bad. Without the portion size, the judgment is incomplete, as the watermelon example shows.
- Mixing up reference scales. Some tables use white bread = 100 instead of glucose = 100. On that older scale, glucose itself scores about 140, so always check which reference a list uses before comparing numbers from different sources.
- Thinking GI is a fixed, universal value. Results are averaged over only 10 people, and preparation and cooking change them. Peeled and unpeeled white potato do not even land in the same GI group.
The takeaway: read the GI as a description of the carbohydrate, and the glycemic load as a description of your actual serving. Two numbers, one multiplication, one division, and you get a far more realistic picture of what is on your plate.